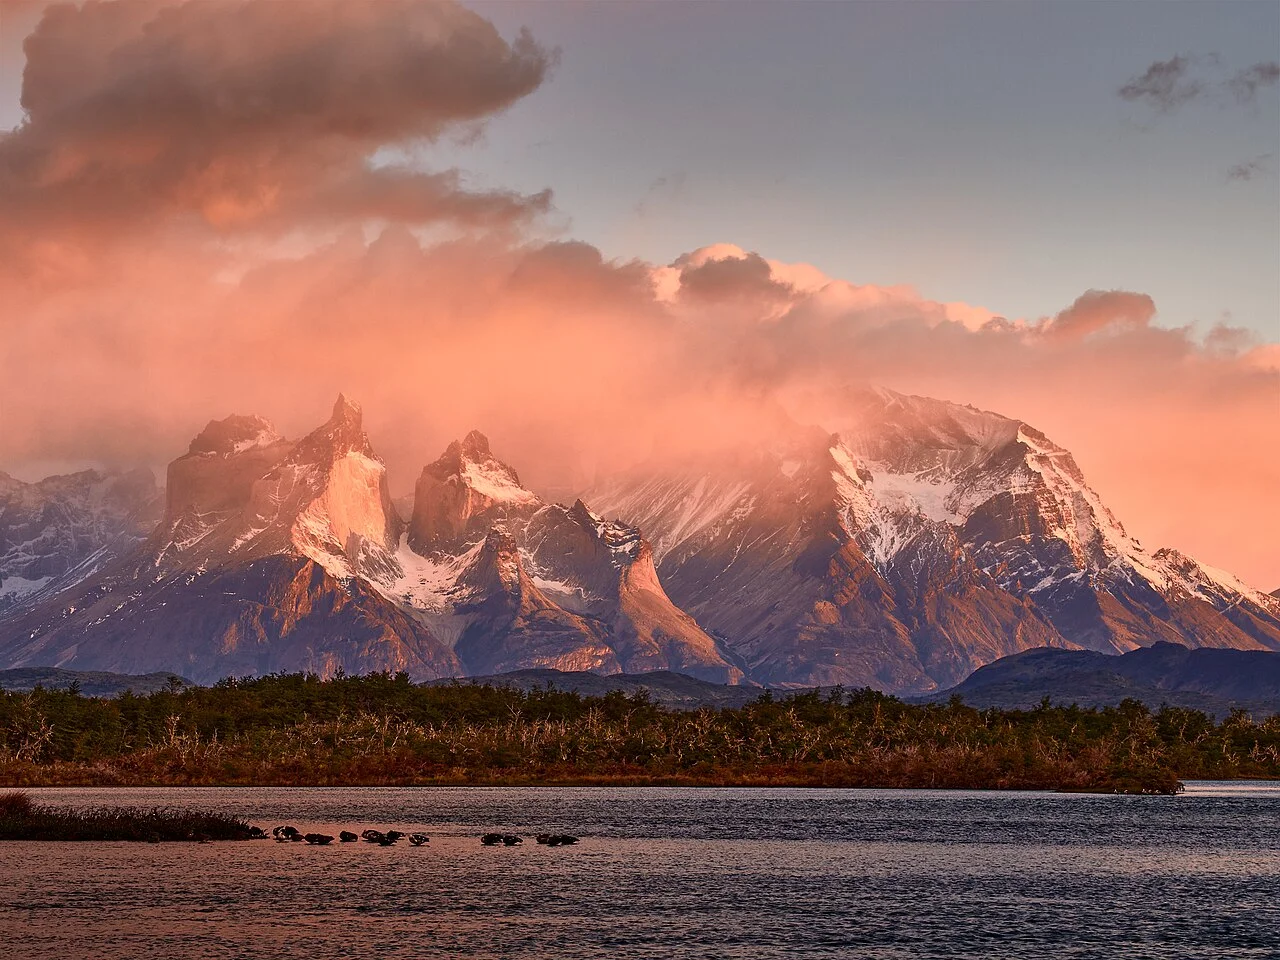
Chile travel seasons at a glance
June-August in more southerly areas
More southerly locations usually have a stronger seasonal reduction than tropical or highland areas. Compare the individual bases, not a national average.
March-May and September-November
Autumn usually brings a falling sun angle and spring a rising one. Neither season is a blanket low-risk guarantee.
December-February
Southern summer generally brings the higher sun angle and greater seasonal exposure. Plan extended outdoor activities away from the local peak UV period.
Northern desert sightseeing, central-city itineraries and southern Patagonia span a substantial latitude range. Coastal coolness is not proof of weak UV.
Desert altitude and southern seasonal daylight require separate planning. The World Health Organization explains that sun elevation, latitude, altitude, cloud, ozone and reflection influence UV. Those physical factors underpin the broad seasonal comparisons here; they do not provide a measured monthly series for Chile.
Chile UV index by month - seasonal planning
This is an editorial, qualitative solar-season guide, not measured monthly UV averages, a weather calendar or a guarantee for a future travel date. Lower winter sun angles generally reduce seasonal exposure, but local conditions can alter the day. The linked monthly pages provide planning context; use the separate hourly forecast for actual protection times.
| Month | Seasonal outlook | Local caution | Plan your day |
|---|---|---|---|
| January | Higher seasonal sun angle | Latitude and elevation change the outlook | Arica January UV |
| February | Higher seasonal sun angle | Latitude and elevation change the outlook | Santiago February UV |
| March | Autumn sun angle declining | Latitude and elevation change the outlook | Punta Arenas March UV |
| April | Autumn sun angle declining | Latitude and elevation change the outlook | Arica April UV |
| May | Autumn sun angle declining | Latitude and elevation change the outlook | Santiago May UV |
| June | Lower seasonal sun angle | Latitude and elevation change the outlook | Punta Arenas June UV |
| July | Lower seasonal sun angle | Latitude and elevation change the outlook | Arica July UV |
| August | Lower seasonal sun angle | Latitude and elevation change the outlook | Santiago August UV |
| September | Spring sun angle rising | Latitude and elevation change the outlook | Punta Arenas September UV |
| October | Spring sun angle rising | Latitude and elevation change the outlook | Arica October UV |
| November | Spring sun angle rising | Latitude and elevation change the outlook | Santiago November UV |
| December | Higher seasonal sun angle | Latitude and elevation change the outlook | Punta Arenas December UV |
Best months for lower UV in Chile
Start with your actual itinerary
More southerly locations usually have a stronger seasonal reduction than tropical or highland areas. Compare the individual bases, not a national average. Compare Arica, Santiago, Punta Arenas. Northern desert sightseeing, central-city itineraries and southern Patagonia span a substantial latitude range. Coastal coolness is not proof of weak UV. Choose a base whose latitude and terrain match the activity you are planning instead of applying the same month rule everywhere.
Balance season with exposure time
A short protected outing can involve less exposure than hours outdoors during a supposedly better month. Look for a shaded route, covering clothing and flexibility to move a long walk or boat trip away from the local peak UV period. A shoulder-season booking does not remove the need to check UV each morning.
Worst months for UV exposure in Chile
Southern summer generally brings the higher sun angle and greater seasonal exposure. Plan extended outdoor activities away from the local peak UV period. Here, best and worst refer only to managing sun exposure, not an overall verdict on visiting Chile. This guide does not rank rain, cyclone risk, trail access, wildlife, prices or sea conditions. Check those independently when booking.
- Before a long excursion: Check the hourly UV forecast at the actual starting point; adjust for a higher route rather than copying a lowland city value.
- On exposed transport: Wear covering clothing and take a hat and sunglasses for open vehicles or boat decks.
- During swimming: Follow water-resistant sunscreen directions and reapply after swimming, sweating or towelling. Time in water is not a substitute for shade.
Regional UV differences across Chile
Arica
18.5 degrees south
Northern desert sightseeing, central-city itineraries and southern Patagonia span a substantial latitude range. Coastal coolness is not proof of weak UV.
Arica local UVSantiago
33.4 degrees south
Desert altitude and southern seasonal daylight require separate planning.
Santiago local UVPunta Arenas
53.2 degrees south
Compare this base with the others using its own forecast. A city value is not a measurement for an entire surrounding region.
Punta Arenas local UVNorthern desert sightseeing, central-city itineraries and southern Patagonia span a substantial latitude range. Coastal coolness is not proof of weak UV. Desert altitude and southern seasonal daylight require separate planning.
Sun protection for your Chile trip
WHO recommends sun protection at UV 3 or above. Use several measures together rather than relying on sunscreen alone. Protection may also be sensible during prolonged exposure or around reflective surfaces when the index is lower.
- Cover: Choose clothing that covers shoulders, arms and legs, a broad-brimmed hat and UV-protective sunglasses.
- Use shade: Move extended activities away from peak UV and take shaded breaks. Scattered cloud and cool breezes do not reliably remove UV.
- Apply sunscreen: Use broad-spectrum SPF 30 or higher, follow local health guidance and the product label, and reapply every two hours and after swimming, sweating or towelling.
- Protect children: Plan shade and covering clothing first; do not wait for reddening before changing the day's schedule.
Burn-time estimates are approximate, not a guaranteed safe exposure allowance. Skin damage can occur before visible burning. Sunscreen does not make unlimited exposure safe. This is general travel information, not individual medical advice.
Plan your Chile trip with local forecasts
Live check
Chile UV right now
Pick a place to see its current UV and an estimated burn time without leaving this guide.
Estimates are approximate, not a safe exposure limit.
Full Arica forecast and hourly UVCompare Arica, Santiago, Punta Arenas using your saved skin and protection preferences. Change the live box to match your base, then open the full forecast for the hourly picture. For another itinerary, explore all destinations or destinations by month.
Chile UV travel questions
Which months should I consider for lower UV in Chile?
More southerly locations usually have a stronger seasonal reduction than tropical or highland areas. Compare the individual bases, not a national average. Desert altitude and southern seasonal daylight require separate planning. The table is seasonal context, not a measured daily or monthly value.
Can I still get sunburned during a cooler trip?
Yes. Temperature does not measure UV, and risk depends on the day's index, skin response, time outside and protection. Wind, swimming and shade between activities can make exposure less obvious.
Can I use one city forecast for the whole trip?
No. Northern desert sightseeing, central-city itineraries and southern Patagonia span a substantial latitude range. Coastal coolness is not proof of weak UV. Use the actual location for the day and check again when changing base or elevation. The live forecast and monthly planning pages serve different purposes.
What SPF should I pack for Chile?
Use broad-spectrum SPF 30 or higher with clothing, shade, a hat and sunglasses; follow local health advice and product directions. Reapply as directed. A larger SPF number is not permission to stay outside indefinitely.
Sources and how to use this guide
Published November 10, 2026. Seasonal labels are editorial interpretations of solar angle and geography, not a measured national UV dataset. No numerical monthly average, fixed protection window or regional exposure score is claimed. WHO sources explain general UV science and protection; they do not independently validate this destination's monthly outlook. Open-Meteo powers the separate live forecast, not this seasonal table.
- WHO - ultraviolet radiation explains latitude, sun elevation, altitude, cloud and reflection, plus the UV 3 protection threshold.
- WHO - the ultraviolet index explains how the index varies through the day and informs protection.
- Open-Meteo - forecast documentation describes the data service used for the live UV check.